الجمعة

Pressure switches


Pressure gauges and switches are among the most often used instruments in a plant. But because of their great numbers, attention to maintenance--and reliability--can be compromised. As a consequence, it is not uncommon in older plants to see many gauges and switches out of service. This is unfortunate because, if a plant is operated with a failed pressure switch, the safety of the plant may be compromised. Conversely, if a plant can operate safely while a gauge is defective, it shows that the gauge was not needed in the first place. Therefore, one goal of good process instrumentation design is to install fewer but more useful and more reliable pressure gauges and switches.


Figure 5-1: Pressure Gauge Designs


One way to reduce the number of gauges in a plant is to stop installing them on the basis of habit (such as placing a pressure gauge on the discharge of every pump). Instead, review the need for each device individually. During the review one should ask: "What will I do with the reading of this gauge?" and install one only if there is a logical answer to the question. If a gauge only indicates that a pump is running, it is not needed, since one can hear and see that. If the gauge indicates the pressure (or pressure drop) in the process, that information is valuable only if one can do something about it (like cleaning a filter); otherwise it is useless. If one approaches the specification of pressure gauges with this mentality, the number of gauges used will be reduced. If a plant uses fewer, better gauges, reliability will increase.


Pressure switches with adjustable setpoints.


Pressure Gauge Designs
Two common reasons for gauge (and switch) failure are pipe vibration and water condensation, which in colder climates can freeze and damage the gauge housing. Figure 5-1 illustrates the design of both a traditional and a more reliable, "filled" pressure gauge. The delicate links, pivots, and pinions of a traditional gauge are sensitive to both condensation and vibration. The life of the filled gauge is longer, not only because it has fewer moving parts, but because its housing is filled with a viscous oil. This oil filling is beneficial not only because it dampens pointer vibration, but also because it leaves no room for humid ambient air to enter. As a result, water cannot condense and accumulate.


Figure 5-2: Pressure Gauge Accessories

Available gauge features include illuminated dials and digital readouts for better visibility, temperature compensation to correct for ambient temperature variation, differential gauges for differential pressures, and duplex gauges for dual pressure indication on the same dial. Pressure gauges are classified according to their precision, from grade 4A (permissible error of 0.1% of span) to grade D (5% error).


Protective Accessories
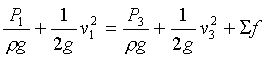
The most obvious gauge accessory is a shutoff valve between it and the process (Figure 5-2), which allows blocking while removing or performing maintenance. A second valve is often added for one of two reasons: draining of condensate in vapor service (such as steam), or, for higher accuracy applications, to allow calibration against an external pressure source.
Other accessories include pipe coils or siphons (Figure 5-2A), which in steam service protect the gauge from temperature damage, and snubbers or pulsation dampeners (Figure 5-2B), which can both absorb pressure shocks and average out pressure fluctuations. If freeze protection is needed, the gauge should be heated by steam or electric tracing. Chemical seals (Figure 5-2C) protect the gauge from plugging up in viscous or slurry service, and prevent corrosive, noxious or poisonous process materials from reaching the sensor. They also keep the process fluid from freezing or gelling in a dead-ended sensor cavity. The seal protects the gauge by placing a diaphragm between the process and the gauge. The cavity between the gauge and the diaphragm is filled with a stable, low thermal expansion, low viscosity and non-corrosive fluid. For high temperature applications, a sodium-potassium eutectic often is used; at ambient temperatures, a mixture of glycerine and water; and at low temperatures, ethyl alcohol, toluene, or silicon oil.
The pressure gauge can be located for better operator visibility if the chemical seal is connected to the gauge by a capillary tube. To maintain accuracy, capillary tubes should not be exposed to excessive temperatures and should not exceed 25 feet (7.5 m) in length. The chemical seal itself can be of four designs: off line, "flow-through" type self-cleaning, extended seal elements, or wafer elements that fit between flanges.
The spring rate of the diaphragm in the chemical seal can cause measurement errors when detecting low pressures (under 50 psig, 350 kPa) and in vacuum service (because gas bubbles dissolved in the filling fluid might come out of solution). For these reasons, pressure repeaters often are preferred to seals in such service. Pressure repeaters are available with 0.1% to 1% of span accuracy and with absolute pressure ranges from 0-5 mm Hg to 0-50 psia (0-0.7 to 0-350 kPa).

Pressure guages come
in a wide variety of
ranges and units.


Pressure Switches
Pressure switches serve to energize or de-energize electrical circuits as a function of whether the process pressure is normal or abnormal. The electric contacts can be configured as single pole double throw (SPDT), in which case the switch is provided with one normally closed (NC) and one normally open (NO) contact. Alternately, the switch can be configured as double pole double throw (DPDT), in which case two SPDT switches are furnished, each of which can operate a separate electric circuit. The switch housings can meet any of the NEMA standards from Type 1 (general purpose) to Type 7 (explosion proof), or Type 12 (oil tight).

Figure 5-3: Pressure Switch Terminology

Figure 5-3 illustrates the terminology used to describe pressure switch functionality and performance. When the pressure reaches the setpoint (which is adjustable within the range), the switch signals an "abnormal condition" and it does not return to "normal" (the reactivation point) until the pressure moves away from the abnormal condition by the "differential" (also called dead-band). The precision of setpoint actuation is called its "accuracy," while the precision of reactivation is called "tolerance."


قياس استواء الاسطح باليزر بالصور

Laser Level Tricks:
Measuring the Flatness of a Plate to 0.0001"


Setup and Reference Test on a Surface Plate

Setup to measure flatness...
You'll need some sort of screen to project on, a place to put the object you are measuring, and a laser level. In this case, we will start by measuring the flatness of the surface plate. The laser level needs to be setup to project a line onto the object. You need to be able to adjust the angle of incidence of the laser to the object, as well as its height, and its parallelness to the surface. If the line is not parallel to the surface, the result looks like this:

Laser line not parallel to the surface...
When properly aligned, it should look like this:

Proper parallelism achieved...
The other adjustment besides parallelism is angle of incidence. You want the angle such that the laser sweeps the entire surface to be measured.

Salt sprinkled on the table will show whether the whole surface is illuminated...
The bottom line is projected directly on the screen and represents a reference as it is a portion of the top edge of the projected light from the laser that overshoots the test object. The top line on the screen is the portion that is reflected from the test surface. Because of the extremely low angle of incidence the entire test surface is illuminated and the entire surface contributes to the reflected image that composes the top line. This is obtained by careful adjustment of the height and angle of incidence of the laser.
The angle of incidence is adjusted so that the beam sweeps the entire surface of the test object. When it is correct the separation between the top and the bottom lines on the screen will be about equal to the thickness of the original laser line multiplied by the ratio of the distance of the laser to the center of the object and the distance from there to the screen. In this setup it is about 5 to 1.
Because of this a multiplication of any errors of slope is obtained. In this setup it amounts to about 240 times. This is arrived at from the ratio of the width of the laser line, about .1 inch, compared to the length of the area it illuminates, about 12 inches. This gives a factor of about 120 but is doubled because the angle of reflection is opposite and equal to the angle of incidence. That gives 240. The amount of multiplication will vary depending on the angle of incidence. If the angle of incidence is kept the same for other test objects the multiplication will remain the same. The lower the angle of incidence the greater the multiplication. The angle of incidence must of course be greater than zero.
The amount of error in slope on a surface depends on what distance that error covers. A concavity of .001" over ten inches produces much less error in slope (about 1/10) than the same .001" over a distance of one inch.
Interpreting Flatness Results

A plate with a small concavity in the center...

The resulting concavity is magnified by the laser...

This tooling plate ought to be flat...

But it's off by about 0.0004" in the center...
How It Works

The distance of the projection magnifies errors in the surface...
What About Parallelism With the Bottom Surface?
If both surfaces are measured flat by this method, we can use a micrometer or other setup to ensure that the thickness is uniform and be satisfied with parallelism. In the end, if we're building a machine table or some such, one can rely on shims to get things well positioned. In this case, mylar from "space blankets" is an excellent precision shimming material being about 0.0005" thick, dimensionally stable, conformal, and it does not absorb much water

Flow Measurement

Flow Measurement

Flow measurement is critical to determine the amount of material purchased and sold, and in these applications, very accurate flow measurement is required. In addition, flows throughout the process should the regulated near their desired values with small variability; in these applications, good reproducibility is usually sufficient. Flowing systems require energy, typically provided by pumps and compressors, to produce a pressure difference as the driving force, and flow sensors should introduce a small flow resistance, increasing the process energy consumption as little as possible. Most flow sensors require straight sections of piping before and after the sensor; this requirement places restrictions on acceptable process designs, which can be partially compensated by straightening vanes placed in the piping. The sensors discussed in this subsection are for clean fluids flowing in a pipe; special considerations are required for concentrated slurries, flow in an open conduit, and other process situations.
Several sensors rely on the pressure drop or head occurring as a fluid flows by a resistance; an example is given in Figure 1. The relationship between flow rate and pressure difference is determined by the Bernoulli equation, assuming that changes in elevation, work and heat transfer are negligible.

Figure 1. Orifice flow meter

Bernoulli's equation

(2)


where Sf represents the total friction loss that is usually assumed negligible. This equation can be simplified and rearranged to give (Foust et. al, 1981; Janna, 1993)


general head meter equation

(3)

The meter coefficient, Cmeter, accounts for all non-idealities, including friction losses, and depends on the type of meter, the ratio of cross sectional areas and the Reynolds number. The compressibility factor, Y, accounts for the expansion of compressible gases; it is 1.0 for incompressible fluids. These two factors can be estimated from correlations (ASME, 1959; Janna, 1993) or can be determined through calibration. Equation (3) is used for designing head flow meters for specific plant operating conditions.
When the process is operating, the meter parameters are fixed, and the pressure difference is measured. Then, the flow can be calculated from the meter equation, using the appropriate values for Cmeter and Y. All constants are combined, leading to the following relationship.

relationship for installed head meter

(4)

In the usual situation in which only reproducibility is required, the fluid density is not measured and is assumed constant; the simplified calculation is where the density is assumed to be its design value of ro. This is a good assumption for liquid and can provide acceptable accuracy for gases in some situations. Again, all constants can be combined (including ro) into C1 to give the following relationship.
relationship for installed head meter with constant density

(5)

If the density of a gas varies significantly because of variation in temperature and pressure (but not average molecular weight), correction is usually based on the ideal gas law using low cost sensors to measure T and P according to
relationship for installed head meter, gas with constant MW, changing T and P

(6)

where the density (assumed constant at ro), temperature (To) and pressure (Po) were the base case values used in determining Co. If the density varies significantly due to composition changes and high accuracy is required, the real-time value of fluid density (r) can be measured by an on-stream analyzer for use as ro in equation (4) (Clevett, 1985).
The flow is determined from equation (5) by taking the square root of the measured pressure difference, which can be measured by many methods. A U-tube manometer provides an excellent visual display for laboratory experiments but is not typically used industrially. For industrial practice a diaphragm is used for measuring the pressure drop; a diaphragm with one pressure on each side will deform according to the pressure difference.
Note that the pressure in the pipe increases after the vena contracta where the flow cross section returns to its original value, but because of the meter resistance, the pressure downstream of the meter (P3) is lower than upstream pressure (P1). This is the “non-recoverable” pressure drop of the meter that requires energy, e.g., compressor work, to overcome and increases the cost of plant operation. The non-recoverable pressure losses for three important head meters are given in Figure 5.
The low pressure at the point of highest velocity creates the possibility for the liquid to partially vaporize; it might remain partially vaporized after the sensor (called flashing) or it might return to a liquid as the pressure increases after the lowest pressure point (called cavitation). We want to avoid any vaporization to ensure proper sensor operation and to retain the relationship between pressure difference and flow. Vaporization can be prevented by maintaining the inlet pressure sufficiently high and the inlet temperature sufficiently low.
Some typical head meters are described briefly in the following.
Orifice: An orifice plate is a restriction with an opening smaller than the pipe diameter which is inserted in the pipe; the typical orifice plate has a concentric, sharp edged opening, as shown in Figure 1. Because of the smaller area the fluid velocity increases, causing a corresponding decrease in pressure. The flow rate can be calculated from the measured pressure drop across the orifice plate, P1-P3. The orifice plate is the most commonly used flow sensor, but it creates a rather large non-recoverable pressure due to the turbulence around the plate, leading to high energy consumption (Foust, 1981).
Venturi Tube: The venturi tube shown in Figure 2 is similar to an orifice meter, but it is designed to nearly eliminate boundary layer separation, and thus form drag. The change in cross-sectional area in the venturi tube causes a pressure change between the convergent section and the throat, and the flow rate can be determined from this pressure drop. Although more expensive that an orifice plate; the venturi tube introduces substantially lower non-recoverable pressure drops (Foust, 1981).

Figure 2. Venturi flow meter

Flow Nozzle: A flow nozzle consists of a restriction with an elliptical contour approach section that terminates in a cylindrical throat section. Pressure drop between the locations one pipe diameter upstream and one-half pipe diameter downstream is measured. Flow nozzles provide an intermediate pressure drop between orifice plates and venturi tubes; also, they are applicable to some slurry systems.
Elbow meter: A differential pressure exists when a flowing fluid changes direction due to a pipe turn or elbow, as shown in Figure 3 below. The pressure difference results from the centrifugal force. Since pipe elbows exist in plants, the cost for these meters is very low. However, the accuracy is very poor; there are only applied when reproducibility is sufficient and other flow measurements would be very costly.

Figure 3. Elbow flow meter.

Pitot tube and annubar:
The pitot tube, shown in Figure 4 below, measures the static and dynamic pressures of the fluid at one point in the pipe. The flow rate can be determined from the difference between the static and dynamic pressures which is the velocity head of the fluid flow. An annubar consists of several pitot tubes placed across a pipe to provide an approximation to the velocity profile, and the total flow can be determined based on the multiple measurements. Both the pitot tube and annubar contribute very small pressure drops, but they are not physically strong and should be used only with clean fluids.

Figure 4. Pitot flow meter.


Figure 5. Flow meter non-recoverable pressure losses (Andrews and Williams, Vol 1, 1979)

The following flow sensors are based on physical principles other than head.
Turbine: As fluid flows through the turbine, it causes the turbine to rotate with an angular velocity that is proportional to the fluid flow rate. The frequency of rotation can be measured and used to determine flow. This sensor should not be used for slurries or systems experiencing large, rapid flow or pressure variation.
Vortex shedding : Fluid vortices are formed against the body introduced in the pipe. These vortices are produced from the downstream face in a oscillatory manner. The shedding is sensed using a thermistor and the frequency of shedding is proportional to volumetric flow rate.
Positive displacement: In these sensors, the fluid is separated into individual volumetric elements and the number of elements per unit time are measured. These sensors provide high accuracy over a large range. An example is a wet test meter.

Table 2. Summary of flow sensors
SensorRangeability1Accuracy2Dynamics (s)AdvantagesDisadvantagesorifice3.5:12-4% of full span--low cost
-extensive industrial practice
-high pressure loss
-plugging with slurries
venturi3.5:11% of full span--lower pressure loss than orifice
-slurries do not plug
-high cost
-line under 15 cm
flow nozzle3.5:12% full span--good for slurry service
-intermediate pressure loss
-higher cost than orifice plate
-limited pipe sizes
elbow meter3:15-10% of full span--low pressure loss -very poor accuracyannubar3:10.5-1.5% of full span--low pressure loss
-large pipe diameters
-poor performance with dirty or sticky fluidsturbine20:10.25% of measurement--wide rangeability
-good accuracy
-high cost
-strainer needed, especially for slurries
vortex shedding10:11% of measurement--wide rangeability
-insensitive to variations in density, temperature, pressure, and viscosity
-expensivepositive displacement10:1 or greater0.5% of measurement--high reangeability
-good accuracy
-high pressure drop
-damaged by flow surge or solids

Notes:
  1. Rangeability is the ratio of full span to smallest flow that can be measured with sufficient accuracy.
  2. Accuracy applies to a calibrated instrument

Flowmeter Applications

Flowmeter Applications

Example of a chemical proportioning system
using +GF+ Signet Flow Systems


Chemical proportioning system
allows for an accurate volumetric ratio to be maintained between the process liquid volume and the chemical injection volume. Real applications include injection or introduction of:
  • vitamins into farm animal drinking water
  • sodium hypochlorite disinfectant into water
  • fertilizer into irrigation water
  • bio-engineered organisms into liquids for manufacturing products such as man-made snow, soaps for large laundries, defoaming chemicals, and insecticides.


A pressure drop is created as water or gas enters through the meter's inlet. The fluid is forced to form thin laminar streams that flow in parallel paths between internal plates separated by spacers. The pressure differential created by the fluid drag is measured by a differential pressure sensor connected to the top cavity plate. The differential pressure from one end of the laminar flow plates to the other end is linear and proportional to the flow rate of the water or gas.


Installing Your Paddle-Wheel Flow Sensor


For best results, allow a straight run of pipe before and after the sensor after any bends, valves, or flow restrictions.
Stated accuracy is not guaranteed unless the Signet installation fittings are used. The installation fitting ensures proper paddle depth and orientation.


In horizontal pipe runs with no air

pockets or sediments present, mount the sensor/fitting in the 12 o'clock or 6 o'clock position. If sediment or air pockets are present, tilt the sensor/fitting at a maximum angle of 45° to avoid these obstacles. Vertical runs require upward flow. Pipes must be full.


كيف تضبط الميكرومتر....هام


Adjusting Micrometers
Adjustments to micrometers are rarely needed, but in some cases adjustments may be necessary. Before any adjustments are made to any measuring instruments, you must first make sure that the instrument is clean and in good condition. Also, in some manufacturing environments, adjustments to measuring instruments can only be done by the inspection department.
Clean the micrometer by lightly closing a piece of paper between the anvil and spindle surfaces of the micrometer. Slide the paper out from between the surfaces and blow out any paper residue that clings to the spindle or anvil


Figure 1 Cleaning the measuring surfaces of the micrometer.


Figure 2 Use the same gaging force when checking the micrometer as you would use when measuring a part.Bring the spindle and anvil together using the ratchet or the friction thimble (Figure 2).
Check the zero point on the barrel against the index line located on the sleeve (Figure 3).

Figure 3 If the zero point and the index line are not in alignment, an adjustment is necessary.


Figure 4
Adjustments to the micrometer are made with the spindle and sleeve in contact with one another.
If an adjustment is necessary, use the spanner wrench, which was included with the micrometer, to turn the sleeve until the line on the sleeve coincides with the zero line on the thimble (Figure 4).

If any play has developed in the spindle screw threads due to wear on the spindle, adjustments to the spindle nut may be necessary. To adjust the spindle nut, back off the thimble until the spindle nut is visible (Figure 5).


Figure 5 Back off the thimble until the spindle nut is visible.

Insert the spanner wrench in the slot of the adjusting nut and tighten just enough to take out the play (Figure 6
).

Figure 6
Use caution not to over-tighten the spindle nut


قياس معدل انسياب الماء والمائع Water flow meter


Water flow meter


This non-contact flow measuring device using Doppler effect / Ultra sonic principle. There is a transmitter and receiver which are positioned on opposite sides of the pipe. The meter directly gives the flow. Water and other fluid flows can be easily measured with this meter


لتحميل الكتب اضغط على الكتاب الذى تريده

Pipeflow Profile Measurements


Captor_water_flow_meter


OpenChannelFlowMeters


تطبيقات على استخدام الكامه والتابع

The purpose of this section is to try and shine some light on where cam and follower systems are used. It also tries to show how dynamic, complex and exciting these uses are. To do this we will examine what is probably the most frequently used cam and follower system which is the cam and follower system in an engine, known to us as the cams and camshaft of an engine. This section concentrates mainly on cam and follower systems in relation to how they are used in engines.

The section is laid out in the following parts:

  1. firstly we will discuss the function of cam and follower systems in an internal combustion engines
  2. then we will consider the mechanisms that the cam and follower system interact with inside the internal combustion engine and
  3. finally we will try to look at the how the cam and follower system interact with these other mechanisms.

The function of Cam and follower Systems in Engines

Camshaft of an Engine

The use of cam and follower systems are vital in engines, where they are used to open and close the inlet valve and the exhaust valve to the cylinder head. The diagram shown opposite shows us a typical camshaft that could be found in a lawnmower engine. The cam and follower system is a plate cam and flat follower system, and of course the function of the system is to open and close the valves at the correct time during the four stroke cycle of the engine (this will be dealt with in more depth later). If you examine the image close you will see that the peaks of the cams are offset by approximately 120 degrees. These ensures that the both valves aren't fully open at the same time.

Camshaft with Plate Cams imparting on a Flat Followers and Valves


Camshaft of an Engine incorporating a Rocker Arm

The diagram shown below is another typical cam and follower system that could be used in an engine. This system incorporates a rocker arm (shown in blue in the image). In this case the motion the cam imparts on the follower is translated to the valve through a push rod amd the rocker arm

What mechanism does the cam and follower system of an engine interaect with inside the engine

The other mechanism that the cam and follower system interact with in an engine is the actual mechanism that produces the power, i.e. the crankshaft, connection rod and piston mechanism. The cam and follower system in an engine is an integral part of the production of power by the engine


Example of a Cam and Follower System at work within an Internal Combustion Engine


ودى كانت اخر شى فى الكامات


مسائل الكامات وحلها المثال الثانى


المثال الثانى
مهم جدا

If a cam when rolling in an anti-clockwise direction imparts the following motion on the follower:

0� to 90�

Rise with Simple Harmonic Motion for 60mm

90� to 130�

Remain at this Displacement (Dwell)

130� to 310�

Fall with Uniform Acceleration and Retardation through 60mm

310� to 360�

Remain at this Displacement (Dwell)

Construct the profile of the cam. The minimum cam radius is 40mm.


الحل

بعد رسم الكام بروفيل هتلاقى الرسمه كدا

اذا لم ترسمها تقريبا بهذا الشكل فراجع نفسك


مسائل الكامات وحلها المثال الأول

المثال الأول
A radial plate cam rotates at 20 revolutions per minute and operates an inline knife edge follower. The nearest approach of the follower to the cam centre is 35 mm. Draw the profile on the cam which will impart the following motion to the follower

Rise 48 mm with uniform velocity

0 to 1 second

Dwell

1 to 1.5 seconds

Return to initial position with uniform acceleration and retardation

1.5 to 3 seconds

الحل


Motion type

Duration of motion Angular displacement

Rise 48 mm with uniform velocity

0 to 1 second

0° to 120°

Dwell

1 to 1.5 seconds

120°to 180°

Return to initial position with uniform acceleration and retardation

1.5 to 3 seconds

180°to 360°

وبعد ما عرفنا نرسم الكام بروفيل تكون الرسمه النهائيه هى: